Original research · updated September 23, 2026
Cold email reply rates by email provider: Microsoft 365, Google Workspace and security gateways
We sent the same campaigns, with the same copy, from the same sending pool, in the same weeks, to people whose company mail runs on different stacks. Inside those campaigns, recipients on Microsoft 365 replied 0.38x as often as recipients on Google Workspace (95% CI 0.36-0.40), about 38 replies for every 100. Recipients behind a security gateway bounced 3.51x as often as unprotected Microsoft 365 or Google Workspace recipients, while replying slightly more often (1.14x). The data covers 327,273 contacted leads across 97 campaigns sent between April 2026 and September 2026.
replies from Microsoft 365 recipients, relative to Google Workspace, inside the same campaigns
bounces behind a security gateway, relative to unprotected recipients
contacted leads across 97 campaigns and 5 programmes, April to September 2026
By Mark Glazer, founder of ReplyLead. First-party campaign data, recipient domains classified with our 10.2M-domain mail provider census. Method · Download the data
Inbox odds · 3 questions
Guess before you scroll
Most people get at least one of these wrong. Lock in a guess, see how close you were, and keep score.
Question 1 of 3
Same campaign, same copy, same week. For every 100 replies from Google Workspace recipients, how many replies came from the same number of Microsoft 365 recipients?
Show the answer
38. Microsoft 365 recipients replied 0.38x as often (95% CI 0.36-0.40).
Question 2 of 3
Recipients behind a security gateway (Proofpoint, Mimecast, Barracuda...). How many times as often did they bounce, compared with unprotected recipients in the same campaigns?
Show the answer
3.51x. Bounces multiplied, while gateway-protected recipients replied slightly more often (1.14x).
Question 3 of 3
Across 9,058,780 domains in B2B contact data that have an MX record, what share receive their email through Microsoft 365?
Show the answer
27.52%, the largest single provider, ahead of Google Workspace at 25.37%. Counting MX hostnames hides this, because each Microsoft tenant gets its own hostname.
0/300
Per 1,000 people contacted: what came back
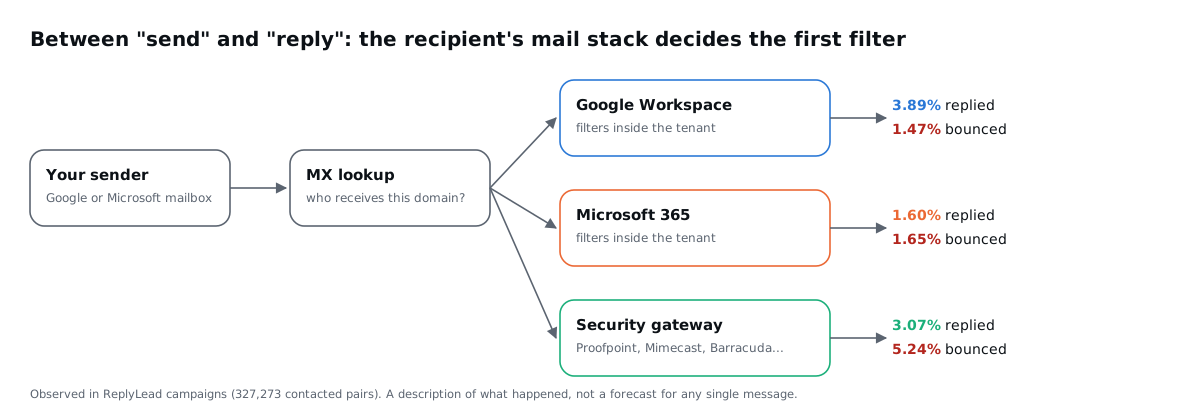
The clearest way to see the gap is to count it. Each panel below is 1,000 contacted people whose company mail runs on that stack. Google Workspace recipients produced about 39 replies per 1,000; Microsoft 365 recipients about 16; recipients behind a security gateway about 31, with 52 bounces. These are pooled rates across all campaigns; the same-campaign comparison below is the one to quote.

Replay it
Same campaign, same copy, same weeks: the comparison that holds
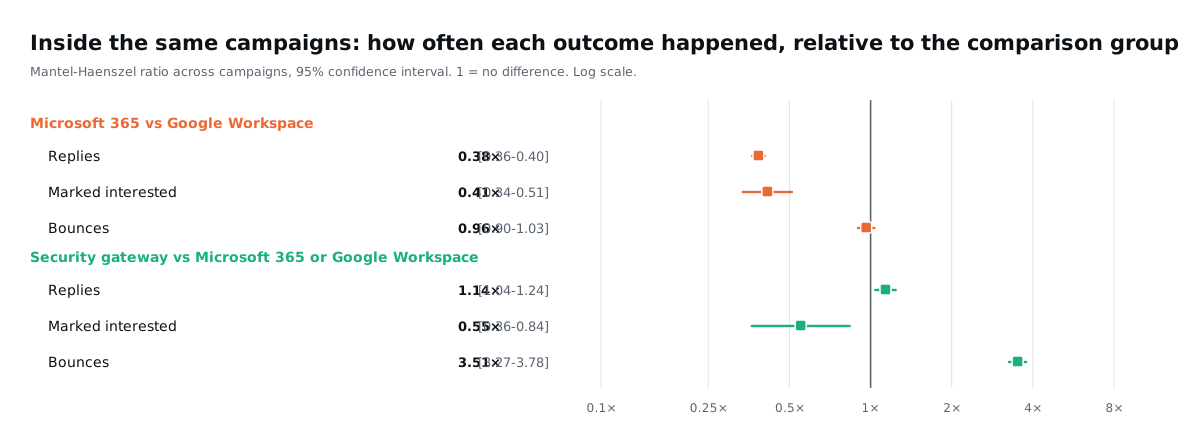
Pooled rates mix different lists and months. To remove that, we compared recipients inside each campaign, where the sending mailboxes, the copy and the calendar were shared, and combined the campaigns with a Mantel-Haenszel ratio. Microsoft 365 recipients replied 0.38x as often as Google Workspace recipients (95% CI 0.36-0.40, 93 campaigns) and were marked interested 0.41x as often. They bounced about as often (0.96x), so the gap is not mail failing at the server: messages were accepted and then answered far less often. Whether they landed in the inbox or a junk folder is not visible in this data.
The gap is not one programme's quirk. Repeating the comparison inside each of our 4 programmes with enough of both groups gave ratios from 0.12 to 0.60: every one below 1.
| Comparison | Ratio | 95% CI | Campaigns |
|---|---|---|---|
| Microsoft 365 compared with Google Workspace: Replies | 0.38x | 0.36-0.40 | 93 |
| Microsoft 365 compared with Google Workspace: Marked interested | 0.41x | 0.34-0.51 | 93 |
| Microsoft 365 compared with Google Workspace: Bounces | 0.96x | 0.90-1.03 | 93 |
| Security gateway compared with Microsoft 365 or Google Workspace: Replies | 1.14x | 1.04-1.24 | 92 |
| Security gateway compared with Microsoft 365 or Google Workspace: Marked interested | 0.55x | 0.36-0.84 | 92 |
| Security gateway compared with Microsoft 365 or Google Workspace: Bounces | 3.51x | 3.27-3.78 | 92 |
Security gateways: replies hold, bounces multiply, and the vendor matters
A security gateway such as Proofpoint or Mimecast accepts mail before the company's Microsoft or Google tenant does. In the same campaigns, gateway-protected recipients replied slightly more often (1.14x) compared with unprotected ones, but bounced 3.51x as often. Because reply counts include automatic replies, the stricter signal is interest: they were marked interested less often (0.55x). Gateways are not interchangeable: Mimecast-protected recipients bounced 15.3% of the time across 3,610 contacted leads, Proofpoint-protected recipients 1.9% across 12,145.
| Gateway | Contacted | Replied | Bounced |
|---|---|---|---|
| Proofpoint | 12,145 | 3.58% 3.27%-3.93% | 1.93% 1.70%-2.19% |
| Mimecast | 3,610 | 0.55% 0.36%-0.85% | 15.26% 14.13%-16.47% |
| Barracuda | 804 | 4.23% 3.04%-5.85% | 8.58% 6.84%-10.72% |
| Sophos | 506 | 6.52% 4.68%-9.02% | 10.47% 8.10%-13.45% |
| Trend Micro | 255 | 3.92% 2.14%-7.07% | 1.96% 0.84%-4.51% |
| Cisco / IronPort | 219 | 2.28% 0.98%-5.23% | 4.11% 2.18%-7.62% |
| Other gateways (Symantec / Broadcom, Forcepoint, Fortinet) | 25 | 8.00% 2.22%-24.97% | 0.00% 0.00%-13.32% |
Tool · runs in your browser
Check your own prospect list
Paste up to 150 domains or email addresses. Each domain's MX record is looked up from your browser through Google Public DNS and grouped exactly as in this study. Nothing is sent to ReplyLead.
0reply potential
Domain by domain
| Domain | MX host | Group |
|---|
The reply potential score is your list's expected reply rate, using the rates observed on this page for each group, divided by the Google Workspace rate (100 = a list that behaves like our Google Workspace recipients). It describes our campaigns, not a forecast for yours.
What we changed after seeing this
We now build a separate campaign for each receiving environment instead of one blended list. That lets us set volume, timing and follow-ups per group, and it keeps a problem in one group, such as a gateway rejecting a sending domain, from hiding inside an average that still looks healthy. Every address is verified before it sends, and the recipient domain's mail provider decides which campaign it joins.
If you buy outbound from an agency, ask how its reply rates split by recipient provider. A single blended number can look fine while a third of the list, the Microsoft 365 third, is barely answering. See also our cold email benchmarks and the provider census.
The data
| Recipient mail provider | Contacted | Share | Replied | Interested per 1,000 | Bounced |
|---|---|---|---|---|---|
| Google Workspace | 131,148 | 40.1% | 3.89% 3.79%-4.00% | 3.3 | 1.47% 1.41%-1.54% |
| Microsoft 365 | 142,210 | 43.5% | 1.60% 1.54%-1.67% | 0.8 | 1.65% 1.58%-1.71% |
| Security gateway | 17,564 | 5.4% | 3.07% 2.82%-3.33% | 1.3 | 5.24% 4.92%-5.58% |
| Other hosts | 35,848 | 11.0% | 4.02% 3.82%-4.23% | 2.8 | 3.33% 3.15%-3.52% |
| No MX record | 284 | 0.1% | 1.76% 0.75%-4.05% | 3.5 | 28.17% 23.26%-33.67% |
| Personal mailbox (Gmail, Outlook.com, Yahoo...) | 219 | 0.1% | 1.83% 0.71%-4.60% | 0.0 | 7.76% 4.90%-12.08% |
Download: CSV · JSON. License CC BY 4.0. Suggested citation: ReplyLead (2026), Cold email reply rates by email provider, replylead.com/cold-email-reply-rates-by-email-provider.html.
Method and limitations
- Unit. One lead in one campaign that was sent at least one email: 327,273 such units across 97 campaigns in 5 programmes, campaigns created 2026-04-01 to 2026-09-21, extracted 2026-09-23. Lead-level outcomes were read from the sending platform; only the recipient domain and outcome fields were kept.
- Recipient provider. The recipient domain's MX host, classified by owner with security gateways checked first, using the same rules as our census. 259,542 of 259,799 domains came from the census; 257 were resolved live.
- Outcomes. Replied = at least one reply, automatic replies included (the platform counts them). Interested = marked interested by whoever worked the inbox, so it can undercount. Bounced = the lead's campaign or lead status is bounced.
- Senders. Mail went out from both Google Workspace and Microsoft 365 mailboxes. Within one campaign both recipient groups were reached by the same sending pool, which is why the same-campaign ratio is the headline.
- Statistics. Wilson 95% intervals for rates; Mantel-Haenszel risk ratios stratified by campaign with Greenland-Robins intervals.
- Limits. This is one operator's campaign book, not a market sample. It is observational: it shows what happened, not why, and it is not a prediction for any single message or sender. Provider share (how common a stack is) is a different measurement from outcome (what happened when we sent to it).
Questions
Is it harder to get replies from Microsoft 365 recipients than Google Workspace recipients?
In our campaigns, yes. Compared inside the same campaigns, Microsoft 365 recipients replied 0.38x as often as Google Workspace recipients (95% confidence interval 0.36 to 0.40), and the gap appeared in each of the 4 programmes we checked separately (ratios from 0.12 to 0.60). It describes what happened in one operator's campaign book, not a rule for every sender.
Do email security gateways block cold email?
They change bounces more than replies. Recipients behind Proofpoint, Mimecast, Barracuda and similar gateways bounced 3.51x as often as unprotected Microsoft 365 or Google Workspace recipients in the same campaigns, while they replied slightly more often (1.14x). Gateways differ from each other: Mimecast-protected recipients bounced 15.3% of the time, Proofpoint-protected recipients 1.9%.
What share of B2B companies use Microsoft 365 for email?
In our census of 9,058,780 domains in B2B contact data that have an MX record, Microsoft 365 receives mail for 27.52%, Google Workspace for 25.37%, and 6.45% sit behind a security gateway. Counting MX hostnames instead of owners hides Microsoft, because every Microsoft 365 tenant gets its own hostname.
How can I find out which email provider my prospects use?
Look up each domain's MX record. The checker on this page does it in your browser through Google Public DNS and groups the results the same way as this study; our mail provider lookup does the same for a single domain.
Should I split cold email campaigns by the recipient's email provider?
We do. After seeing gaps like these we build separate campaigns for each receiving environment, so volume, timing and follow-ups can be tuned per group and a problem in one group does not hide inside a blended average.